At my cycling team's training camp last weekend I used my Flip video camera to record video of some of the hill descents. Several teammates thought it would be neet to see the video with telemetry data (such as speed) overlayed on top of it. Since I had my GPS recording at the time it was a straightforward matter to create such a video. Here's how I did it.
In preparation I exported my GPS data to a GPX file, which Mathematica can import. Next, I used QuickTime Player Pro to convert the movie into a sequence of PNG images, which Mathematica can import.
Set the working directory to this notebook's directory for convenience.
SetDirectory[NotebookDirectory[]];
Import the data from the GPX file.
xml = Import["Descent.gpx", "XML"];
Pull out all the "trkpt" elements.
trkpts = Cases[xml, XMLElement["trkpt", _, _], Infinity];
Length[trkpts]
Length[trkpts]
204
First[trkpts]
XMLElement[trkpt, {lat->37.6150774, lon->-89.2330897}, {XMLElement[ele, {}, {222.6824951}], XMLElement[time, {}, {2009-03-29 16:09:18}]}]
Extract the latitude/longitude/elevation/time from each trackpoint.
latitudes = ToExpression["lat" /. #[[2]]]& /@ trkpts;
longitudes = ToExpression["lon" /. #[[2]]]& /@ trkpts;
elevations = Cases[trkpts, XMLElement[
"ele", _, {e_String}] :> ToExpression[e], Infinity];
dates = Cases[trkpts, XMLElement[
"time", _, {t_String}] :> DateList[t], Infinity];
longitudes = ToExpression["lon" /. #[[2]]]& /@ trkpts;
elevations = Cases[trkpts, XMLElement[
"ele", _, {e_String}] :> ToExpression[e], Infinity];
dates = Cases[trkpts, XMLElement[
"time", _, {t_String}] :> DateList[t], Infinity];
pts = Transpose[{latitudes, longitudes, elevations}];
Compute the distance between each successive trackpoint.
distances = GeoDistance[
GeoPosition[#[[1]], "WGS84Original"],
GeoPosition[#[[2]], "WGS84Original"]
]& /@ Partition[pts, 2, 1];
GeoPosition[#[[1]], "WGS84Original"],
GeoPosition[#[[2]], "WGS84Original"]
]& /@ Partition[pts, 2, 1];
Compute the time interval between each successive trackpoing.
times = First[DateDifference[#[[1]], #[[2]], "Second"]]& /@
Partition[dates, 2, 1];
Partition[dates, 2, 1];
Speed = distance/time. Convert from Meter/Second to Mile/Hour.
<<Units`
speeds = (Convert[# Meter/Second, Mile/Hour] Hour/Mile)& /@
distances/times;
distances/times;
Since there are more video frames than GPS trackpoints we're going to want to know what the speed is between trackpoints. To do this we'll create an InterpolatingFunction. At any time between two trackpoints we'll estimate the speed to be a linear interpolation between the speed at those two points.
absoluteTimes = Drop[AbsoluteTime /@ dates, 1];
interp = Interpolation[Transpose[{absoluteTimes, speeds}]];
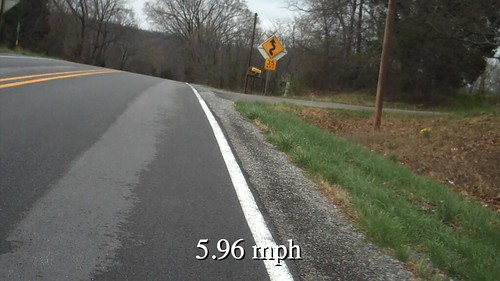
For each frame of the video we will import the PNG file, compute the speed for that frame of video, draw the speed on top of the video, then export the new frame.
processFrame[i_Integer] := Module[
{label, istr, img, g},
label = ToString@NumberForm[
interp[First[absoluteTimes]+i*1/29.97], {Infinity, 2}];
label = StringJoin[label, " mph"];
istr = IntegerString[i, 10, 4];
img = Import[StringJoin["Descent", istr, ".png"]];
g = Show[
Rasterize[img],
Graphics[Style[{
Text[label, Scaled[{0.5, 0.1}], {0, 0}],
Style[Text[label,
Offset[{-4, 4}, Scaled[{0.5, 0.1}]], {0, 0}]
, FontColor -> White]
}, FontSize -> 72]]
];
Export[StringJoin["DescentProcessed", istr, ".png"], g];
g
];
processFrame[1]
Call the processFrame[] function for each frame (and wait a potentially long time).
With[{start = 1, stop = 9606}, Monitor[
Do[processFrame[i], {i, start, stop, 1}],
ProgressIndicator[Dynamic[(i - start)/(stop - start)]]
]]
Do[processFrame[i], {i, start, stop, 1}],
ProgressIndicator[Dynamic[(i - start)/(stop - start)]]
]]
Once all the frames have been exported we can recombine them back into a single movie using QuickTime Player Pro.
2 comments:
Good thing we didn't train in the polar regions. Then you would need uber-precise longitude coordinates, or you might just look like "il Falco" on the descent.
Harrah's Cherokee Casino & Hotel - MapYRO
Find casinosites.one your way around the casino, find where everything is located with the 1xbet login most up-to-date information about Harrah's Cherokee Casino & Hotel in 출장샵 Cherokee, jancasino NC. 토토 사이트 모음
Post a Comment